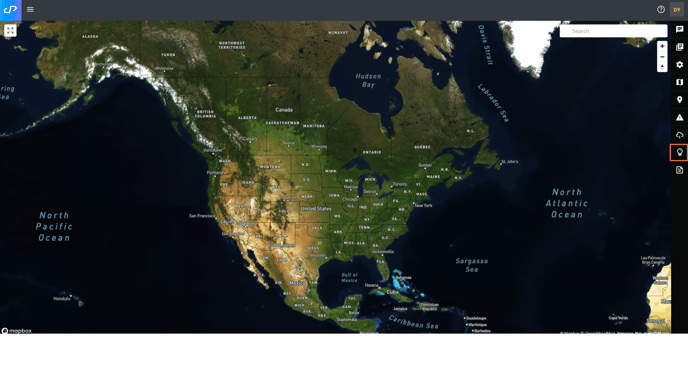
What are Impact Models?
Impact Models show localized climate impacts in the U.S.
To access the risks of energy outages in a specific region, follow these steps:
-
Toggle the Energy Reliability Index switch.
-
Choose the mean scenario or percentage probability from the drop-down.
-
Click on the area you would like to explore.
-
Select the ERI Forecast button. A chart will appear.
-
Choose Chart or Table from the menu.
The Energy Reliability Index (ERI) quantitatively assesses the reliability of electric grids.

Note: Charts can be downloaded by clicking the Save as Image button.